Welcome to the 2022 Advocacy Benchmark Report!
Trends, Analysis, & Best Practices from 555 Million Advocacy Emails

Trends, Analysis, & Best Practices from 555 Million Advocacy Emails
As FiscalNote’s flagship advocacy product, we at VoterVoice are delighted to bring you the latest edition of our popular advocacy benchmark report. Now in its fourth year, this highly anticipated report analyzes campaign data from 2021 and the first half of 2022, providing a comprehensive view of advocacy campaign performance and trends.
We reviewed more than 555 million email messages sent in 2021 and the first half of 2022, over 50 million pageviews to VoterVoice clients’ Action Centers, over 10 million text messages, and more than 34,000 advocacy campaigns, and this report is packed with those valuable findings from a busy year in advocacy. These numbers represent more than 2,000 organizations in 50 industries, each one making an impact on important issues affecting advocates, voters, and citizens.
Overall and industry-specific advocacy email open and action rates
Best time of the year, hour of the day, and day of the week to send advocacy emails
Mobilization rates from 50 industries in 17 sectors
The organizations included in this report range from small and large nonprofits to corporations and trade associations, from both sides of the aisle, and who advocate in support of, or against, the widest spectrum of causes and issues imaginable.
After our comprehensive view of 2021, we included a section with data from the first six months of 2022, so you have access to the most up-to-date metrics to aid your digital advocacy efforts heading into the midterm elections.
Attentive readers of our annual report might notice that open and action rates are somewhat different from past years due to Apple’s privacy changes made in 2021. According to Apple’s official announcement: “In the Mail app, Mail Privacy Protection stops senders from using invisible pixels to collect information about the user. The new feature helps users prevent senders from knowing when they open an email.”
Since more than 52 percent of visits to VoterVoice clients’ action centers come from iPhone devices, this change prevents accurately tracking email opens. This means the open counts are slightly different than in previous years.
We hope you find this data-led research report insightful and that it helps you better refine your strategy and find scalable digital advocacy success.
The percentage of recipients who received your emails in their inboxes and opened them, regardless of whether they had a call-to-action or not. Due to the aforementioned Apple Mail Privacy Protection, these metrics look slightly different than in previous years.
The percentage of recipients who opened your call-to-action emails and followed through by taking the action you requested of them.
Emails in which an organization asks something of the recipients. Sign a petition, email a lawmaker, send a tweet, etc.
Emails, such as newsletters, updates, etc., that do not include an “ask.”
The number of people who saw your email in their inbox and decided its content wasn’t relevant to them, so they asked to be taken off your email list.
The percent of emails that were successfully delivered to the intended recipient. This number is often affected by old addresses or lists not being updated.
The number of emails sent using VoterVoice. There could be thousands of emails sent as part of one campaign, which is why the number of messages is always higher than the number of campaigns.

The number of campaigns sent through VoterVoice. Each campaign could have a varied number of total emails sent, which is why the number of campaigns is always lower than the number of messages.
The overall action rate for emails sent through VoterVoice in 2021 was 9.4 percent and the open rate surpassed 28 percent, the highest over the last four years. Advocacy organizations sent more than 353 million emails using VoterVoice, which is 8 percent higher than in 2020.
With a sea of pressing issues and the midterm elections looming, advocates are more engaged than everand and advocacy organizations are becoming more strategic to get their attention.
Thanks to VoterVoice’s human curation of outgoing messages that resolves any technical issues, deliverability rates have stayed consistently above 95 percent, ensuring your advocates actually receive your emails.
VoterVoice clients who used the tool’s track and resend capabilities nearly doubled their action rates. The track and resend feature makes it easy to automatically follow up with those who haven’t taken action yet.
Text messaging use has seen a huge jump for advocacy campaigns, and while the number of messages sent increased incrementally since 2017, from 2020 to 2021 the number of messages sent more than doubled. More than 7,480,000 advocacy text messages were sent by our clients in 2021. Action rates for SMS have also increased gradually, reaching 1.6 percent in 2021.
We broke down the emails sent through VoterVoice by type: informational vs. call to action. Following the trend from previous years, informational emails have higher open rates than call-to-action emails, though the gap was almost closed this year. Call-to-action emails now perform nearly as well with open rates as informational emails, indicating that advocates are willing to act and spend their time making a difference.
Unsubscribe rates remained very low year over year for both email types in 2021, and deliverability rates stayed high. These great metrics speak volumes about our clients keeping their contact lists engaged, clean, and updated. Great job!
It’s hard to compete for attention on the Hill, particularly amid a global crisis like the COVID-19 pandemic — until a certain threshold of messages is reached. During Cruise Lines International Association’s campaign to resume cruising, emails from the cruise community reached every U.S. congressional office — all 100 U.S. senators and 435 members of the House of Representatives. More than 47,000 advocates sent over 155,000 messages in support of cruise resumption to members of Congress, making it impossible for policymakers not to pay attention.
For call-to-action emails, VoterVoice users are able to specify targets for their email campaigns. As in previous years, state-level campaigns were the most popular, showing the highest volume and highest action rate (tied with campaigns that combine federal and state). This is no surprise since we’ve repeatedly seen how advocacy professionals get better results when they connect their issues and action calls to their advocates’ daily lives.
We asked our clients in advocacy roles where their public policy issues are mostly based, and unsurprisingly the majority — 53 percent — said their issues are based at the state level, while 39 percent said they expect to see local government shaping the landscape for their organization in the next five years.
We asked our clients in advocacy roles how they would best describe their work in 2021. The majority (over 46 percent) said they are working harder, compared with last year, and feeling optimistic about the future.
We also asked what your biggest challenges are in your advocacy role, and overwhelmingly those challenges are the volume of issues to monitor, a small team size, and lack of time and budget.
Traffic to VoterVoice clients’ Action Centers was healthy across the board, expanding exposure to your issues and your call-to-action campaigns. More than 10 million users visited your action centers in 2021, for a total of 37 million overall pageviews.
In 2021, direct traffic was still the number one traffic driver to VoterVoice clients’ Action Centers, with half of all traffic reaching Action Centers this way. This means advocates reached your pages either with a direct link they typed on their browser, maybe through a link sent via text, or perhaps your supporters have your page bookmarked and keep coming back to take action.
Following the trend from previous years, social media traffic was a big driver as well. This is no surprise as we see social media play an important role in advocacy campaigns. However, social media traffic was down slightly from just under 21 percent in 2020 to nearly 16 percent in 2021.
This may be because of the rise in traffic from referrals at nearly 29 percent. Referral traffic to your action centers came from another website outside of the main search engines and social networks. This could be your main website or your partners’ websites linking back to your action center.
While organic search traffic (coming from Google, Bing, Yahoo, etc.) remains low (only about 4 percent, similar to the previous year), it’s still an important way action centers can get new eyeballs, especially on hot-button issues. Some advocates rely on search engines to find new ways to take action on the issues they care about. Organic search is a powerful way to find and recruit new advocates, so this is definitely a channel to continue focusing on.
Two years ago, mobile traffic was just starting to emerge as the device people used the most to access FiscalNote Advocacy clients’ Action Centers, leading with just 4 percent more traffic than desktops. In 2021, that lead has grown by leaps and bounds, with nearly three-quarters of traffic coming from mobile devices, dwarfing desktop and tablet users.
This is a trend that is only expected to grow. Insider Intelligence predicts that by 2023, mobile usage will account for 35 percent of total media time. They found that among the 219.2 million adult smartphone users, the average time spent on smartphones in 2021 hit 3 hours and 46 minutes, up 8 minutes from 2020.
What does this mean for advocacy? Create your content — emails, subject lines, and social media posts — always keeping in mind that most people will be consuming it from their mobile devices.
In 2021, we saw a shift in the trend over the last several years; now men are the main visitors to VoterVoice clients’ action centers, bringing in 53 percent of the traffic. In the last two years, women were the main visitors, but were surpassed by male visitors in 2021.
In terms of ages, we saw another shift in 2021: visitors to your Action Centers are getting younger. While in 2020 the largest group of visitors were 55 or older, this year the number of 25-34 visitors was almost identical.
Now, we’ll do a deep-dive into 2021 to dissect how your advocates engaged with your campaigns on a monthly basis. We’ll be looking for patterns and shifts that can help you further optimize your advocacy strategy.
In 2021, the number of campaigns totaled 22,365 with 353.7 million emails sent.
Get the insight, as well as the tools and tactics you’ll need from those who’ve gone before, to knock your next campaign out of the park.
Year over year, we have seen that, in terms of sheer volume, the first two quarters are the busiest. However, 2021 was the first year that March was not the busiest month for email volume, and the busiest months were instead April and September. The second half of the year has seen a marked increase in message volume and a greater flurry of activity than past years.
Mobilizing Your Advocates: Strength in Numbers
In only two months, Credit Union National Association (CUNA) sent more than 3.6 million messages to credit unions across the country requesting their support, reaching an impressive 31.4 percent open rate. CUNA’s members not only opened their emails, but they were also inspired to take action and share this ask with their networks. In total, advocates across the country sent more than 850,000 messages to members of Congress.
Learn more
Looking a bit deeper into each month of 2021, engagement rates show an interesting trend. We saw in the previous section of this report that the highest number of emails went out in April, but August saw the highest action rates — though it’s followed closely by September.
Unsubscribe rates remained consistently low, at 0.1 percent, only rising to 0.2 percent in January, while deliverability rates stayed steady in the high 90th percentile.
Let’s zoom in on your call-to-action campaigns in 2021. VoterVoice clients saw the highest open rates in January, but August took the cake for the highest action rates.
September, however, is a close second when it comes to action rates and it also shows a good open rate, meaning January and September could be good months for your call-to-action campaigns. There’s less competition for attention in your advocates’ inboxes with a good chance of them opening your message and taking action.
With so many lawmakers up for reelection this year, the focus on constituents is greater than at any other time in the election cycle. That means organizations are in a prime position to push forward the issues important to their members, clients, or donors. Our team of advocacy experts has put together a multi-pronged strategy for bringing lawmakers to your side during an election year.
In 2021, open rates for informational emails continued to climb. December reached nearly 33 percent open rates, which is the highest open rate for informational emails we’ve seen. This could be due to Apple’s Mail Privacy Protection taking effect in June 2021 but even in January, the open rate for informational emails was over 30 percent.
Unsubscribe rates remained impressively low throughout the year, though slightly higher in January, meaning your advocates wanted to hear from you and remained engaged all year.
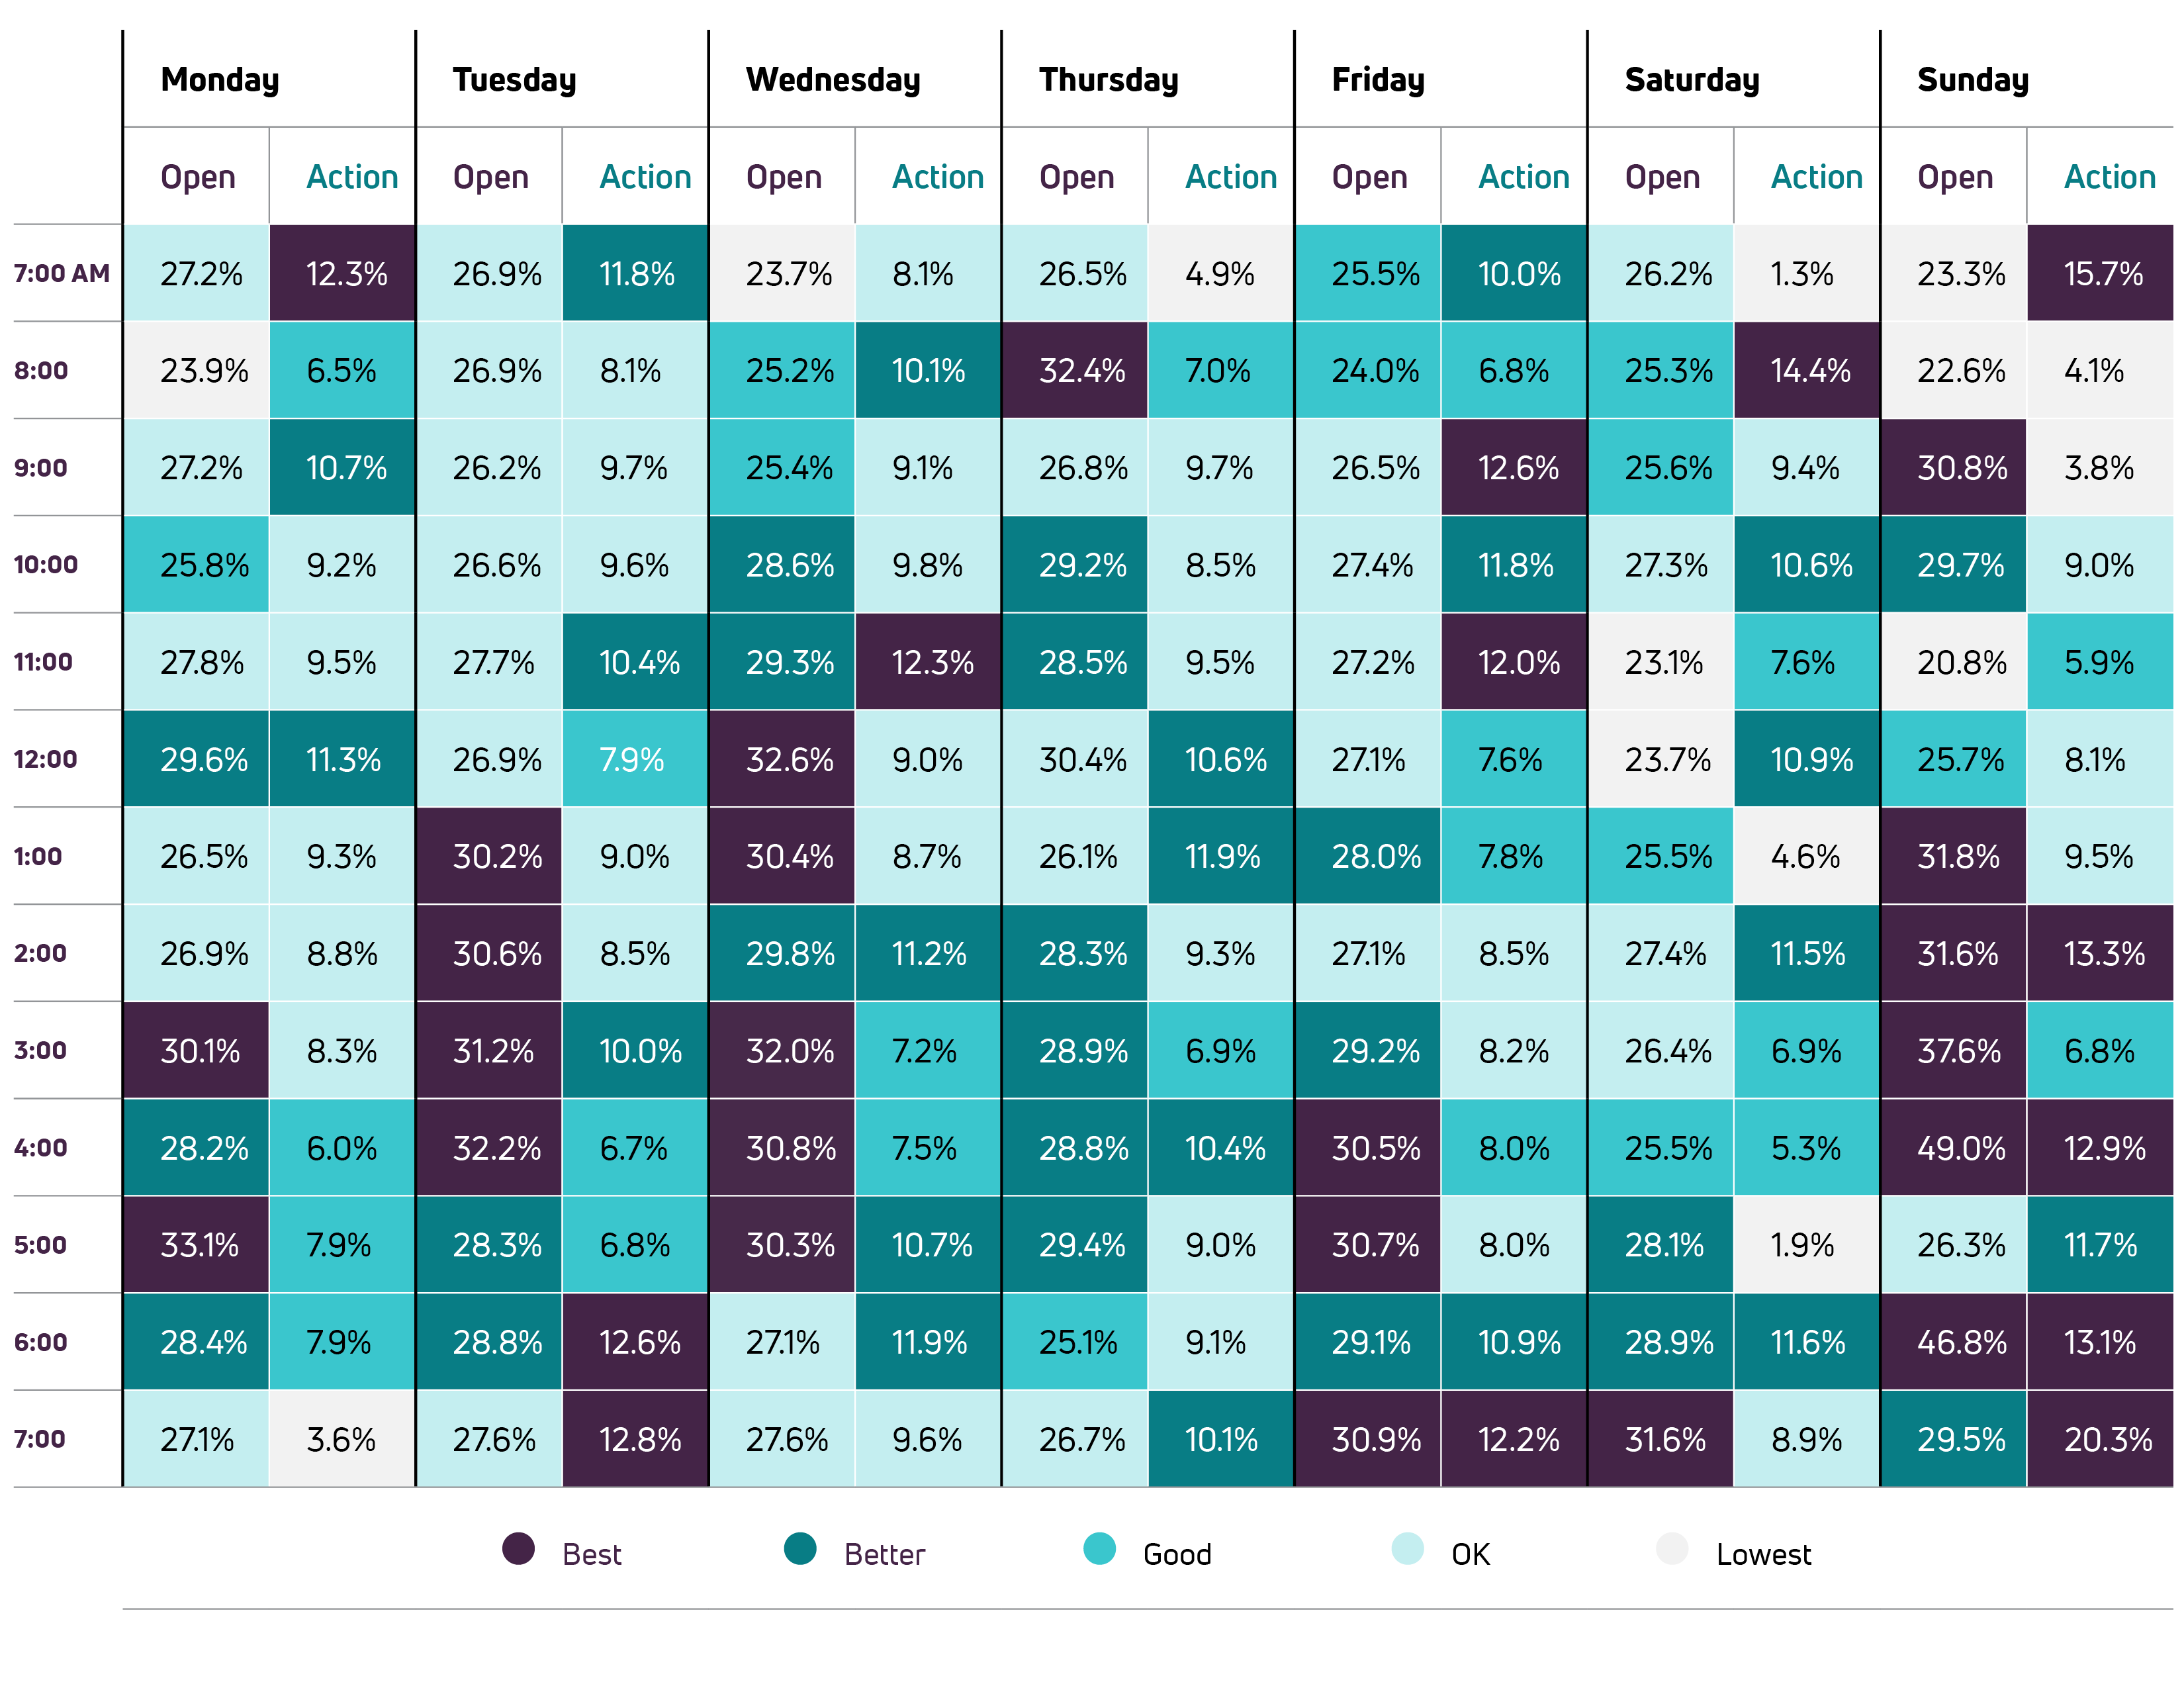
One of the main concerns of any advocacy professionals is finding the sweet spot of the best date and time combination to send an email campaign. You want to make sure you message people at a time they are willing to open your message and are available to take action on your request, while avoiding competing for attention with multiple other email campaigns.
Similar to the last two years, in 2021 most campaigns happened between 8 a.m. and 5 p.m. with the biggest surge in activity between 9 a.m. and 3 p.m. VoterVoice clients saw the highest overall open rate at 3 p.m.
Read on to get a deeper understanding of these metrics and to find the best date/time combinations for your advocacy campaigns
While a lot depends on your audience’s demographics, most VoterVoice clients sent email campaigns between 8 a.m. and 5 p.m., which follows the same trend of past years. And that has seemed to work since you saw very high open and action rates overall in 2021. But engagement metrics could indicate it’s time to try shaking things up to see whether your advocates are more responsive outside working hours.
When it comes to engagement, the best open rates happen after 3 p.m., even though that’s when campaigns start to dwindle. This may be because the volume of messages can make it hard for your supporters to pay attention to your messages since there are lots of other emails competing for attention.
As for action rates, 6 p.m. holds the top spot so, overall, the evening presents a good opportunity for advocacy campaigns with the highest action rates.
Looking specifically at call-to-action campaigns, 11 a.m., 6 p.m., and 7 p.m. come on top when it comes to action rates paired with good open rates. As mentioned, the competition is fiercer during prime work hours, so it may be worth an evening send to encourage advocates to engage and take action while their inboxes are less inundated.
Informational emails follow a similar trend where most engagement comes later in the day. In fact, the highest open rate for VoterVoice clients’ informational email campaigns was at 4 p.m. with an impressive 30.9 percent.
Interestingly, while 4 p.m. is when campaigns start to taper off, engagement remains high for a couple of hours, continuing to confirm that inbox saturation can play a big role in engagement.
As we’ve seen in previous years, Friday continues to be the busiest day for sending advocacy campaigns, closely followed by Tuesday. Saturday has one of the lower action rates, while Sundays show the highest open and action rate of the entire week but make up less than 2 percent of the campaigns.
The most successful days of the week are no longer the workweek, perhaps due to the rise of people viewing messages on their mobile devices and able to check their email at any time of the day or week. Last year was the first time we saw weekends taking the lead both in terms of open and action rates, and 2021 continues that trend.
While it all depends on your advocates’ demographics and behavior, it’s worth trying to send a campaign on a weekend, since most people have a bit more free time, there are far fewer emails competing for their attention, and they are shown to be more likely to open your emails and take action.
Overall, looking at the open and action rates per day and per hour, we saw that in 2021 VoterVoice clients saw the highest open rate on Sundays at 4 p.m. However, Sunday also saw a low volume of campaigns, with less than 2 percent of campaigns sent on that day. There are many opportunities to conduct successful campaigns throughout the week, though. For example, Tuesdays at 3 p.m., Wednesdays at noon, or Fridays at 7 p.m. all show positive open and action rate combinations.
”“Having an overall view of what’s happening across campaigns in an aggregate way is a good way for you to be tracking how you’re doing in your grassroots work and to be able to understand your own engagement level, interactions, and where you need to make tweaks in terms of strategy.”
Hasan Shah, Director, Grassroots & Member Engagement, AdvaMed
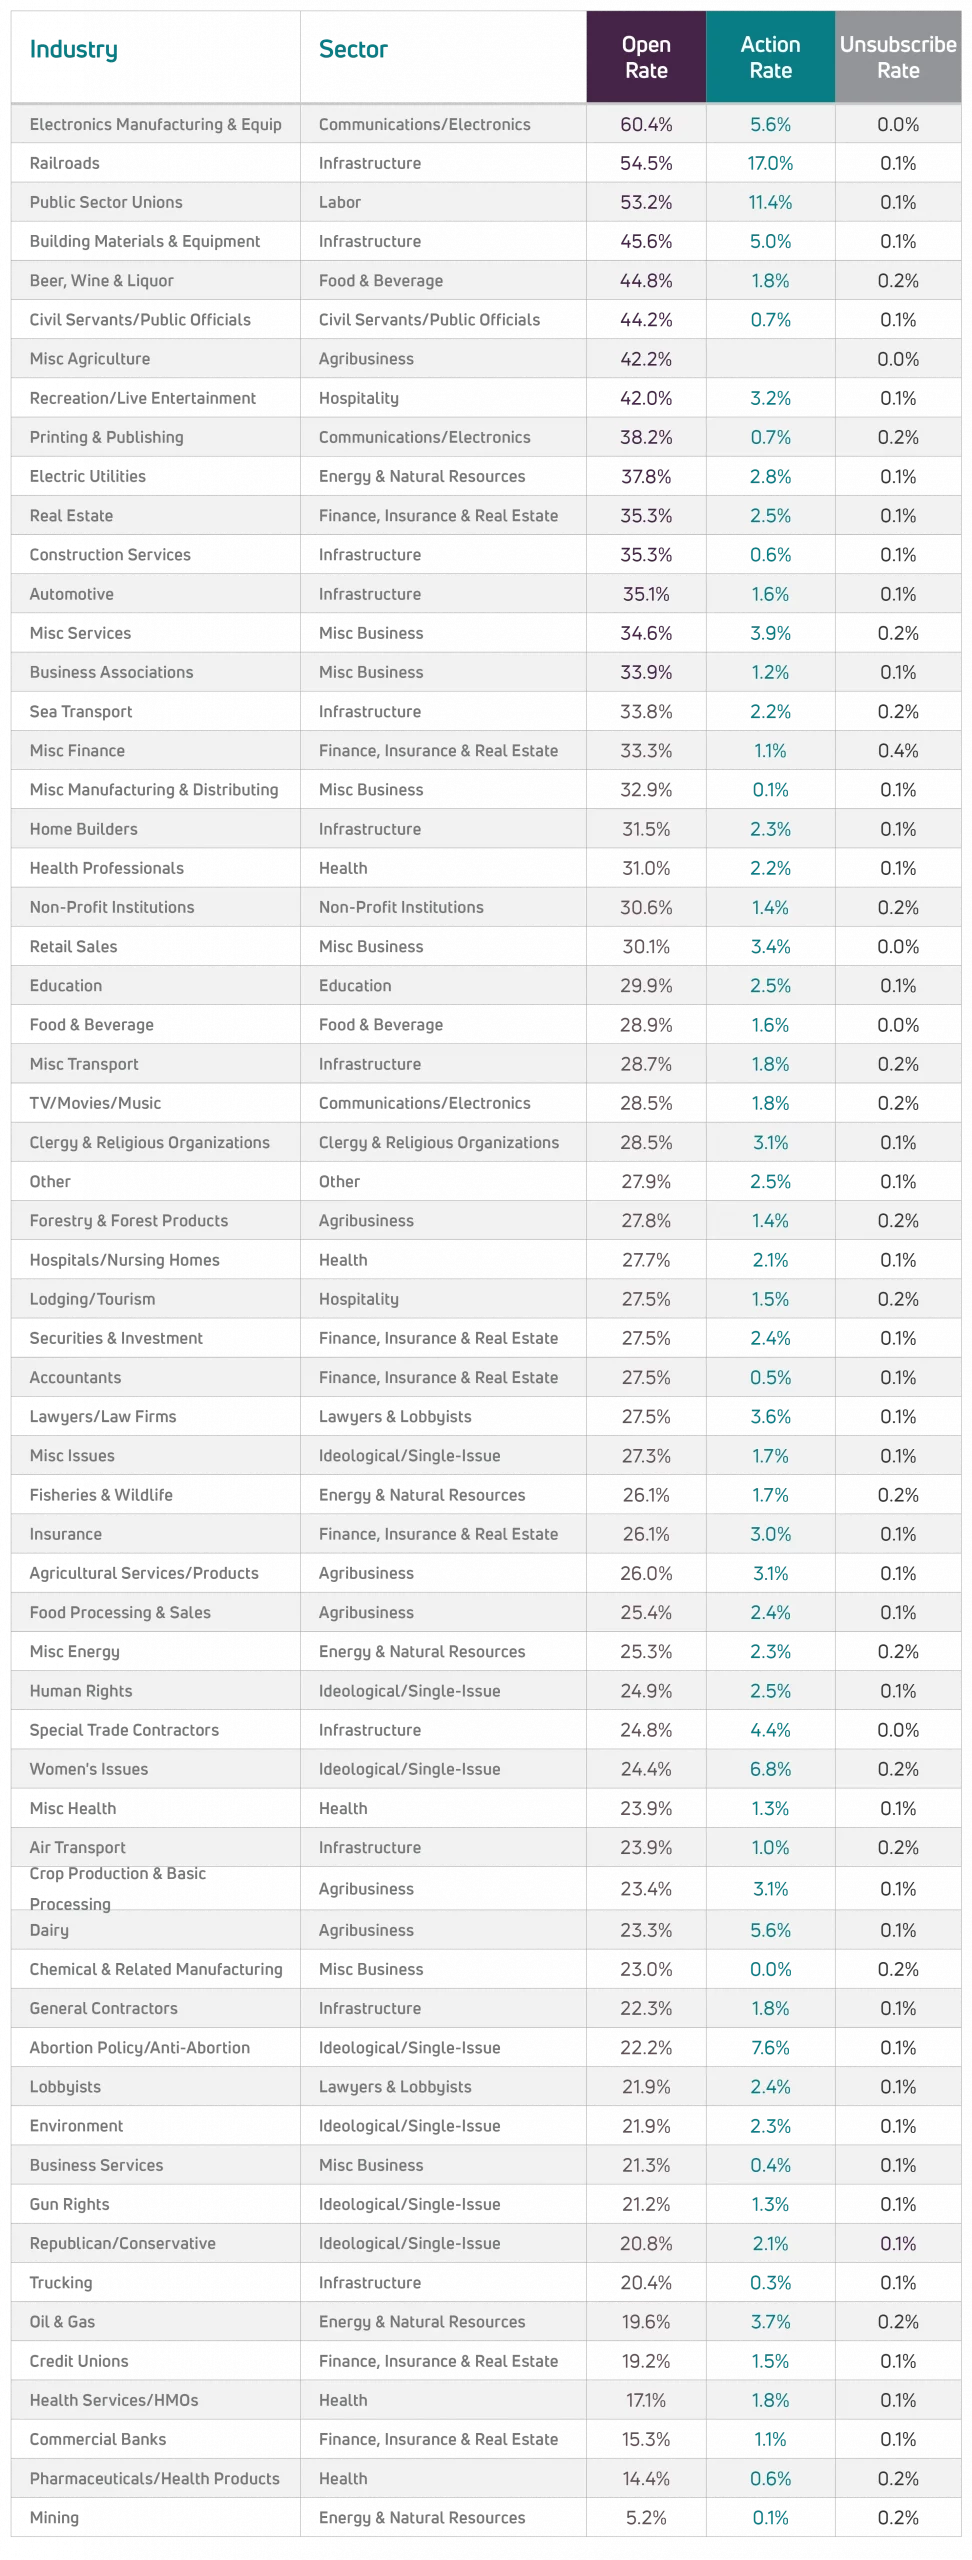
So far, we’ve studied overall metrics from all VoterVoice clients across an array of sectors and industries. Now, we take a deep dive into the metrics from 17 sectors to help you understand how your industry performs and develop a competitive advantage in your field.
The sectors are divided into 17 broad categories comprising 50 industries. While in previous years the hospitality sector saw the highest open rates, this year the labor sector overtook them, with an impressive 53.3 percent open rate. The labor sector also had by far the highest action rate at nearly 18 percent.
While civil servants/public officials had the second-highest open rate at 44 percent, this sector also saw the lowest action rate, with less than 3 percent.
We looked at advocacy campaigns across agribusiness industries including crop producers, dairy farming businesses, food farmers, agricultural and farm services, and agricultural associations. We also assessed agribusiness that included processors, agri-products, and services.
Overall, September and December saw the highest open rates in 2021 but action rates were highest in the summer months. This sector saw higher overall action rates than any other in 2021.
Industry sentiment
When surveyed, government affairs professionals in the agriculture industry indicated that they worked harder in 2021 compared to 2020, with 63 percent saying this is true. However, this industry has an overall negative outlook toward the future (nearly half of those surveyed) and had less energy and motivation compared with 2020 (37 percent). When compared with other industries, those in the agricultural sector seem less energized and optimistic about the future.
The sector is made up of a wide array of industries including services, associations, sales, and many other miscellaneous organization types.
While action rates in the business sector increased, they remained lower than average, following the trend we have seen over the last several years. Action rates were the highest in July and August, even though open rates were at their lowest.
Industry sentiment
When surveyed, government affairs professionals in the business sector overwhelmingly agreed that their biggest challenge is not having enough time to accomplish what they need to — 70 percent said this is the case. The other biggest challenges for this sector are having a team size that is too small and a high volume of issues to monitor.
Organizations including federal, state, and municipal employees, as well as fire and police, state and local government entities, and other employee organizations make up the civil servant and public official sector.
While civil servants/public officials had the second-highest open rate at 44 percent, this sector also saw the lowest action rate, with less than 3 percent. The months with the highest campaign volume were March and July.
This sector saw its highest action rate in September, reaching an impressive 15.1 percent. This may align with the major world events happening during this time, including the Afghanistan conflict and Texas passing a controversial abortion ban.
We looked at data from organizations such as ministries, charities, conferences, dioceses, religious institutes, and associations, among orders. Religious institutions that operate education or healthcare facilities are not included in these metrics but are analyzed as part of their core industry.
This sector saw similarly high open rates as 2020, even reaching more than 30 percent in the winter months. December continues to have the highest open rates for this sector, probably due to religious holidays. However, action rates peaked in May and June.
We looked at advocacy data from the electronics manufacturing and equipment industry; internet organizations and associations; TV, movie, and entertainment fields; as well as other miscellaneous communications and electronics organizations.
Open rates soared to above 50 percent in April, July, and November for this sector, while action rates remain modest throughout the year. Campaign volume for this industry was low overall, but the most campaigns were sent in the month of April.
When surveyed, professionals in the communications sector said their biggest challenge is building a network with industry peers and lawmakers, with nearly 56 percent sharing this sentiment. This sector indicated they rely heavily on news subscriptions, legislative trackers, and CRM software to do their jobs.
Organizations included in the education sector range from higher education and K-12 to school boards and PTA organizations.
While in 2020 action rates struggled to reach double digits, in 2021 action rates improved, particularly doing well during school recess months: July, August, and December.
We include aggregate data from oil and gas producers and utilities, mining, renewal and fossil fuels, electric utilities, and waste management. It also includes the wildlife and fisheries category as a natural resource.
Similar to 2020, the most engagement for this sector comes early in the year, with the highest action rate in March. Overall, the energy and natural resources sector saw consistently good open rates throughout 2021 with action rate spikes in March, April, and August.
In this sector, we look at data from banks, credit unions, finance companies, securities, mortgage bankers, broker organizations, and the broad category of insurance.
Open rates are consistently higher than average throughout the year, and action rates they display consistent engagement. Similar to the last two years, April is one of the strongest performing months in terms of action rates for this sector.
Industry sentiment
The factors that cause the most anxiety in the day-to-day jobs of people in this sector are time constraints (58 percent) and political environment (46 percent), our survey indicated.
This sector includes a wide variety of food and drink packaging, manufacturing, and marketing organizations. Some examples are feed and grain; confectionary; fruits and vegetables; and wine, beer, spirits, soft drinks, and water.
Open rates soared in February and August for this sector, surpassing 50 percent. Action rates remained modest throughout the year, similar to last year, though action rates neared 13 percent in February, significantly higher than the rest of the year. This sector saw the highest overall open rates of any in 2021.
This sector includes health professionals, hospitals and nursing home facilities, health services, pharmaceuticals, and health products and supplies.
The health sector remained front and center during 2021 with the global COVID-19 pandemic, and open and action rates held steady throughout the year, though action rates peaked in June.
Industry sentiment
Unsurprisingly, professionals in this sector indicated the political environment caused the most anxiety in their day-to-day jobs, along with lack of resources and fear of missing something important related to legislation and regulation in healthcare.
This sector’s industries include everything from lodging and tourism organizations to recreational and live entertainment industries.
While the hospitality and culture sector continued to be one of the hardest hit by the COVID-19 pandemic, campaign open rates remained high throughout the year, surpassing 50 percent in May when COVID-19 vaccines started to become more readily available to the general public.
It was in February, amid a flurry of news and updates about COVID-19 vaccines, that action rates neared 17 percent, the highest for the sector and higher than any of the sector’s action rates in 2020.
The sector is formed by contractors, transportation, automotive, the construction of roads and bridges, and everything else in between, as well as miscellaneous organizations such as those dealing with inland waterways, sewage, power lines, and so forth.
In 2021, the infrastructure sector saw slightly higher open rates and action rates than in 2020, with a spike in open rates beginning in August and continuing through the end of the year, while action rates peaked in September.
The labor sector classifies miscellaneous unions, including industrial, building, transportation, and public-sector unions.
The labor sector saw much higher open and action rates in 2021 than in previous years, with particularly hefty action rates in March and September, months that also saw a high volume of campaigns. These action rates above 30 percent are in stark contrast to 2020, when action rates remained below average throughout the year and did not reach the double digits.
This sector saw improvements across the board when compared to 2020, with increased open and action rates and especially high open rates in April.
Industry sentiment
When surveyed, lawyers and lobbyists indicated that they are optimistic about the future, with 42 percent agreeing with this sentiment. This sector also feels like they worked harder in 2021 than in 2020, 45 percent said.
This sector encompasses nonprofits, foundations, and philanthropic organizations that don’t naturally fall into other categories covered earlier. It excludes single-issue or ideological organizations. Examples include museums, charitable foundations, philanthropic endowments, and trusts.
The nonprofit sector saw open rates higher than 2020 this year, with action rates rising notably in August and September.
Industry sentiment
Professionals in this sector said COVID-19 continued to affect their job-related stress in 2021, with more than 81 percent saying their stress increased due to the pandemic.
In the “other” sector, we compile the data for all the organizations that don’t comfortably fall into any of the other sectors. We include them here because their numbers contribute to creating the overall metrics laid out in the overview at the beginning of this section.
Compared to 2020, this sector saw a healthy increase in open rates and action rates in 2021, with action rates remaining in the double digits for most of the year. In particular, abortion policy and women’s issues within this sector saw some of the highest action rates across all industries in 2021.
Ideological or single-issue organizations can be focused on partisan issues, such as gun control, immigration, groups supporting a single candidate, abortion, human rights, and so on. These types of organizations tend to have passionate supporters and detractors, which could explain the above-average action rates.
Turning to the top-performing industries, we get a picture of which ones got the most engagement on their 2021 campaigns. We specifically look at open and action rates, as well as the entire breakout of industries within the sectors we studied.
The top 10 open rates within specific industries rose from 2020, when the top open rates barely passed 40 percent. In 2021, the top industry open rate — public sector unions — hit 53 percent.
wdt_ID Industry Sector Open Rate
1
Public Sector Unions
Labor
53.2
2
Civil Servants/Public Officials
Civil Servants/Public Officials
44.2
3
Real Estate
Finance, Insurance & Real Estate
35.3
4
Business Associations
Misc Business
33.9
5
Health Professionals
Health
31.0
6
Non-Profit Institutions
Non-Profit Institutions
30.6
7
Education
Education
29.9
8
Misc Transport
Infrastructure
28.7
9
Clergy & Religious Organizations
Clergy & Religious Organizations
28.5
10
Other
Other
27.9
The U.S. Hemp Roundtable used VoterVoice to spearhead an initiative to press Congress to regulate hemp-derived CBD as a dietary supplement and a food and beverage additive. This organization created a stand-alone campaign through VoterVoice to mobilize Hemp Supporters across the nation. In only two months, the campaign engaged 370 supporters that sent more than 1,190 emails to 279 recipients in Congress.
Public sector unions and agricultural services/products had the top action rates in 2021, knocking abortion policy from it’s number one spot held for the last several years.
| wdt_ID | Industry | Sector | Action Rate |
|---|---|---|---|
| 1 | Public Sector Unions | Labor | 11.4 |
| 2 | Agricultural Services/Products | Agribusiness | 3.1 |
| 3 | Clergy & Religious Organizations | Clergy & Religious Organizations | 3.1 |
| 4 | Other | Other | 2.5 |
| 5 | Real Estate | Finance, Insurance & Real Estate | 2.5 |
| 6 | Education | Education | 2.5 |
| 7 | Human Rights | Ideological/Single-Issue | 2.5 |
| 8 | Environment | Ideological/Single-Issue | 2.3 |
| 9 | Health Professionals | Health | 2.2 |
| 10 | Hospitals/Nursing Homes | Health | 2.1 |
2022 has already brought many political and social upheavals: changes to the Supreme Court, COVID-19 vaccine mandates, gun violence, the Russia-Ukraine war, and an economic slowdown. How did advocacy campaigns fare in the face of all these changes?
In this next section, we look at the data for the first six months of 2022 and how that compares to the same period in 2021, illuminating the latest data and potentially what is to come for the remainder of the year.
In the first six months of 2022, we see open rates jump compared with the previous three years to nearly 37 percent. The action rate was slightly lower, but deliverability rate was higher than in the last three years.
Following the trend of 2021, text messages continue to grow as a medium to communicate with advocates. VoterVoice clients sent more than 3 million advocacy text messages in the first half of 2022, with an open rate of nearly 7 percent and a higher action rate than we’ve seen in past years, at 2.6 percent.
When it comes to informational and call-to-action emails specifically, the first six months of 2022 saw good levels of open and action rates for both categories. Twice as many informational campaigns have been sent compared to call-to-action campaigns, and they perform similarly for action and unsubscribe rates.
Most of the campaigns in the first half of 2022 happened at the state level, which follows the trends we’ve seen every year. The number of state campaigns was more than seven times that of federal campaigns.
State campaigns and combined federal+state campaigns had the highest action rates, which is a positive sign of your advocates understanding the urgency of your messages. When it comes to action rates, these campaigns also had the best results with a nearly 37 percent open rate.
During the first half of 2022, VoterVoice users sent 202,052,375 emails through our platform, which is approximately 13 percent higher than in the first half of 2021. As we’ve seen in previous years, the spike in message volume came in March. In 2022, approximately three to four times more informational emails are sent than call-to-action messages.
The best open rate during the first half of 2022 came in May and the best action rate occurred in February. So far, 2022 has seen good engagement across the board as advocates are showing up to open and click on your email advocacy campaigns.
Call-to-action emails saw open rates increase in 2022 compared to that period in 2021 by about 10 percent, while action rates remained consistent with what we saw in the previous period. Unsubscribe rates, at 0.1 percent each month, were also even lower than what we’ve seen in previous years.
Open rates for informational emails were, on average, slightly above open rates for call-to-action emails for the first six months of 2022. Again, open rates were significantly higher than this period in 2021, while unsubscribe and failure rates were lower, indicating that supporters are engaged and want to receive your messages.
In the first six months of 2022, close to 4 million people visited your action centers. People found VoterVoice clients’ action centers primarily through direct traffic, following the trend from previous years. This could indicate that advocates bookmarked your organizations’ action centers so they could keep coming back to access the latest information.
Besides direct traffic, organic search traffic and email saw an increase compared with this period in 2021, while social media was slightly lower. An increase in organic search traffic is good news, as advocacy organizations can get new advocates through organic discovery of your action center.
During the first six months of 2022, advocates aged 35-44 made up the majority of those visiting your action centers, showing your audiences continue to get younger. While in the first six months of 2020, the majority of users were 65 or older, now this age group is one of the smallest segments represented.
As for gender, the majority of advocates are female, which had been the trend during this time period for the last few years. However, in the first half of 2022 (as we saw previously on page X), men continued to gain ground with a 4.5 percent jump year over year.
In the first half of 2022, the ideological/single-issue sector was the most active with a total of 3,275 campaigns. During the same period in 2021, this sector was also the most active, though this year they sent 521 more campaigns than the previous year.
When it comes to open rates, the labor sector got an exceptional 64 percent average open rate for the period as well as the highest action rate, at 23 percent, far outpacing other sectors.
When it came time to mobilize advocates to take action, public sector unions had the best results once again, with an average action rate of nearly 23 percent.
| wdt_ID | Sector | Industry | Open Rate |
|---|---|---|---|
| 1 | Labor | Public Sector Unions | 63.9 |
| 2 | Civil Servants / Public Officials | Civil Servants / Public Officials | 52.6 |
| 3 | Finance, Insurance & Real Estate | Real Estate | 44.5 |
| 4 | Health | Health Professionals | 42.3 |
| 5 | Infrastructure | Misc Transport | 40.8 |
| 6 | Non-Profit Institutions | Non-Profit Institutions | 40.6 |
| 7 | Ideological / Single-Issue | Environment | 39.7 |
| 8 | Education | Education | 39.3 |
| 9 | Clergy & Religious Organizations | Clergy & Religious Organizations | 38.2 |
| 10 | Agribusiness | Agricultural Services / Products | 36.2 |
Public sector unions and agricultural services/products had the top action rates in 2021, knocking abortion policy from its number-one spot held for the last several years.
| wdt_ID | Sector | Industry | Action Rate |
|---|---|---|---|
| 1 | Labor | Public Sector Unions | 22.8 |
| 2 | Ideological / Single-Issue | Human Rights | 19.6 |
| 3 | Agribusiness | Agricultural Services / Products | 11.0 |
| 4 | Ideological / Single-Issue | Misc Issues | 9.3 |
| 5 | Health | Hospitals / Nursing Homes | 8.7 |
| 6 | Education | Education | 8.1 |
| 7 | Clergy & Religious Organizations | Clergy & Religious Organizations | 7.9 |
| 8 | Health | Health Professionals | 6.7 |
| 9 | Health | Health Services / HMOs | 6.6 |
| 10 | Infrastructure | General Contractors | 6.5 |
In our new version of this comprehensive, data-driven report we looked at several thousand advocacy platform users over 2021 and the first six months of 2022. For this report our research and engineering teams looked at the advocacy data from more than 34,000 advocacy campaigns, coming from more than 2,000 organizations, resulting in over 555 million emails to advocates.
For the email metrics, we divided the advocacy campaigns into two categories: informational and call to action. Information campaigns have no specific ask but provide information content including newsletters or educational emails. More than 14,700 of the campaigns sent were informational.
Call-to-action campaigns are meant to drive advocates to an advocacy effort. Close to 7,700 campaigns encouraged the recipients to do something, such as email a lawmaker. For these, we measured what the follow-through on the requested action was. Those are the “action” rates.
Once we had all that data, we started to break up the email open and action rates by sector and industry, to see if there were significant differences between the sectors.
Seventeen different sectors were identified based on large groupings, which were then broken down into 50 industries. For example, health could include everything from nursing homes to professional medical organizations to medical device industries to pharmaceuticals.
To keep our reporting accurate, we did not include any industries for which we had fewer than 10 clients to ensure a reasonable sample size of campaigns and to maintain client confidentiality.
FiscalNote advocacy solutions bring together more than 50 years of digital advocacy experience from the multiple product lines from CQ and VoterVoice, under the umbrella of FiscalNote, to give you the most comprehensive set of tools available on the market.
Only VoterVoice provides a three-pronged approach to your advocacy campaigns. Mobilize your supporters to message lawmakers in multiple ways through our flagship product VoterVoice, while simultaneously finding new advocates where you’re thin on the ground with our Advocate Acquisition program. Then, reach the legislators that matter with an advocacy media advertising package from Roll Call.
That comprehensive approach is why 2,400 advocacy clients trust us with their most important campaigns.
The most feature-rich digital advocacy solution on the market, VoterVoice is FiscalNote’s flagship advocacy platform, with all the tools you need to mobilize your base, amplify your message, and quickly execute and measure your campaigns.
Drive advocates to your action center by email, text, or push notification, and match them to their correct legislators at the local, state, or federal level. Track and resend capabilities make it easy to follow up with those who haven’t taken action yet, and SmartLink technology prefills advocate information, making it easier than ever to take action. VoterVoice also integrates with FiscalNote’s issues management platform, making it easy to launch an advocacy campaign directly from a bill’s page in the core platform.
Additionally, VoterVoice’s mobile action center includes everything the desktop platform offers, as well as the ability to manage fly-ins and coordinate in-person Hill or district meetings.
Daniel Argyle
Veronica Magan
Lydia Stowe
Paul Ellender
David Huang
Krishnaveni Reddy
Whit Robinson
Sarah Yang
Morgan Phillips
Zuma Hajiyeva